
docker中使用loki+promtail搭建日志收集系统
1.创建docker-compose.yaml
version: "3"


volumes:
  vol-loki-data:
    name: loki-data
    driver_opts:
      type: none
      o: bind
      device: ${PWD}/data/loki_data/loki


services:
  loki:
    restart: always
    image: grafana/loki:2.9.6
    ports:
      - "3100:3100"
    volumes:
      - vol-loki-data:/loki

    command: -config.file=/etc/loki/local-config.yaml

  promtail:
    restart: always
    image: grafana/promtail:2.9.6
    volumes:
      - /var/log:/var/log
      - /opt/module/:/apps
      - ./data/promtail/etc/config.yml:/etc/promtail/config.yml
      - ./data/promtail/tmp:/tmp
    command: -config.file=/etc/promtail/config.yml
promtail的volumes将需要采集的日志目录进行挂载,后面promtail可以从容器内挂载的路径采集日志
2.创建promtail配置文件
vim ./data/promtail/etc/config.ymlserver:
http_listen_port: 9080
grpc_listen_port: 0
positions:
filename: /tmp/positions.yaml
clients:
- url: http://loki:3100/loki/api/v1/push
scrape_configs:
- job_name: system
pipeline_stages:
static_configs:
- labels:
job: varlogs
host: localhost
__path__: /var/log/*.log
- labels:
job: app_logs
host: localhost
__path__: /apps/**/*.out
__path__ 配置为前面挂载的路径即可采集到主机的日志
labels为配置的日志采集源,更多写法参照官网
3.创建并启动容器
docker compose up -d4.Grafana中查看日志
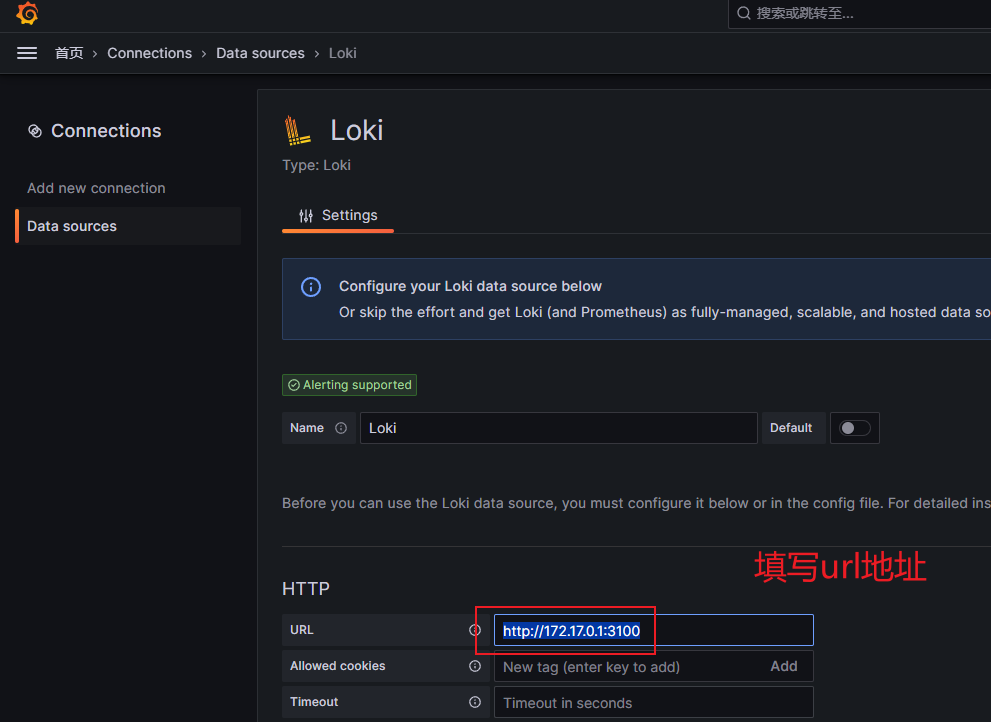
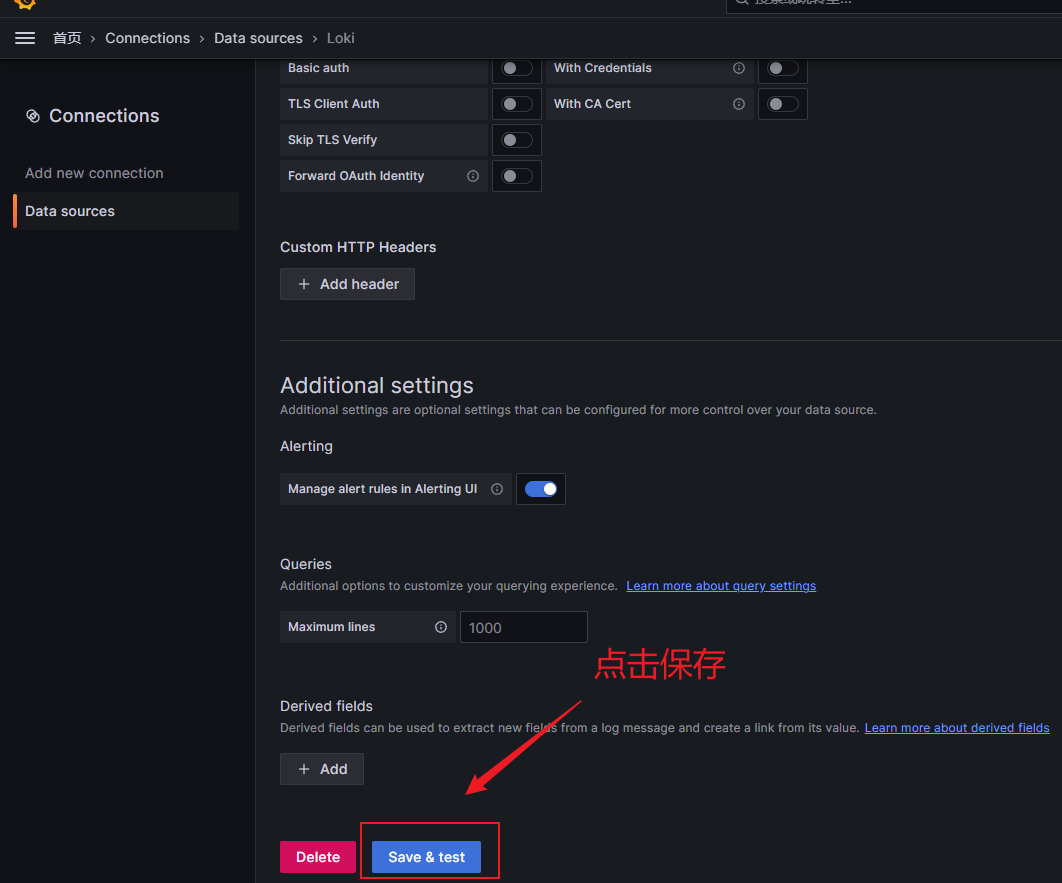
部署Grafana请查看文章: docker部署grafana
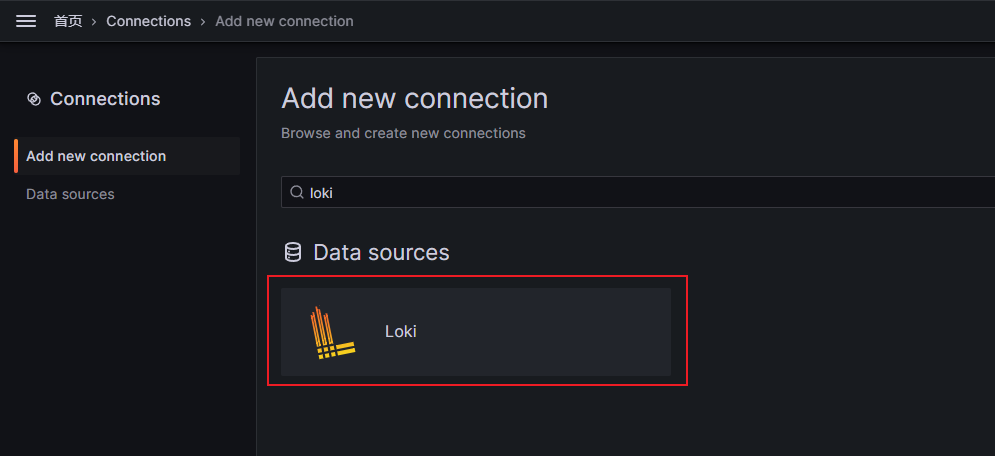
导入仪表盘
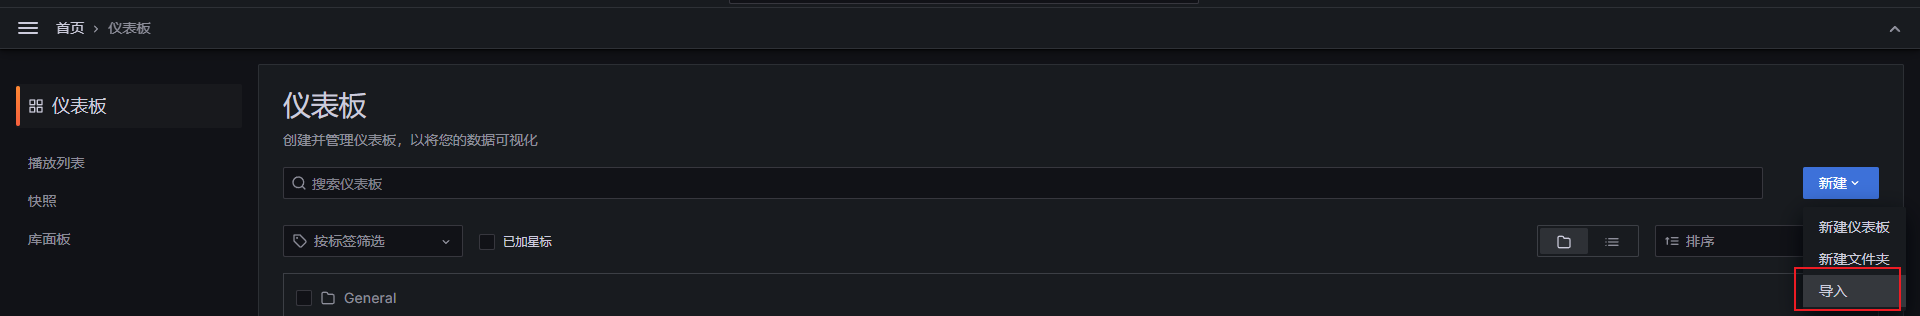
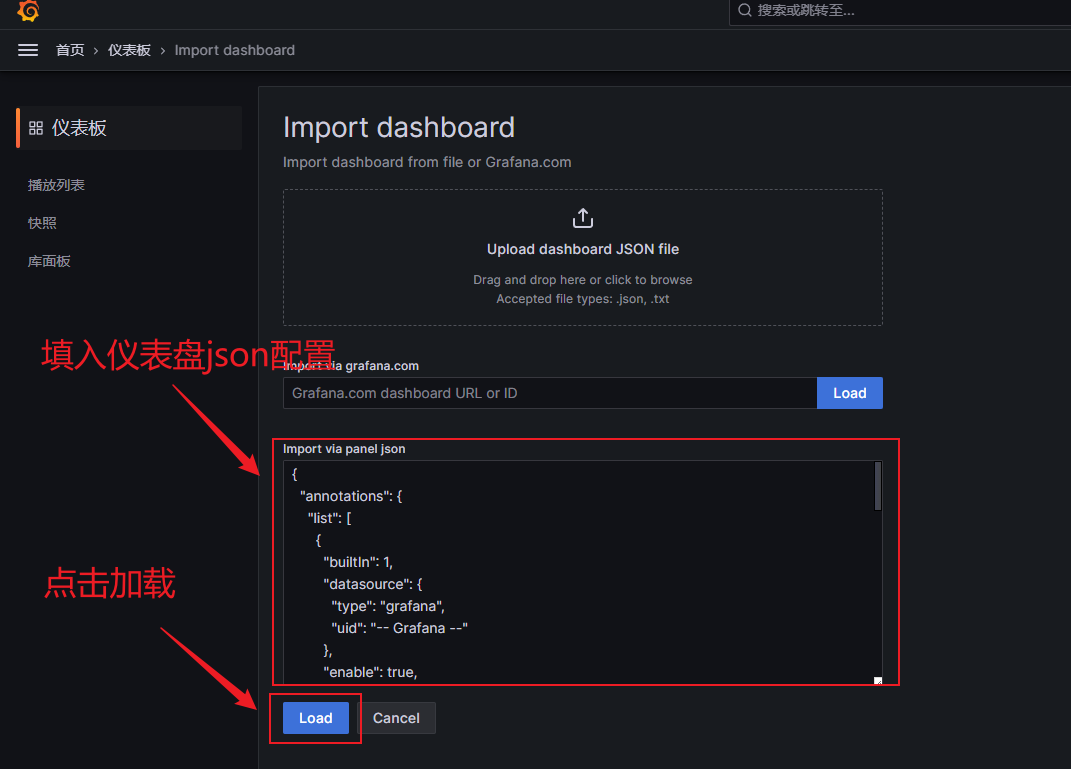
仪表盘json配置
{
  "annotations": {
    "list": [
      {
        "builtIn": 1,
        "datasource": {
          "type": "grafana",
          "uid": "-- Grafana --"
        },
        "enable": true,
        "hide": true,
        "iconColor": "rgba(0, 211, 255, 1)",
        "name": "Annotations & Alerts",
        "type": "dashboard"
      }
    ]
  },
  "editable": true,
  "fiscalYearStartMonth": 0,
  "graphTooltip": 2,
  "id": 17,
  "links": [],
  "liveNow": false,
  "panels": [
    {
      "datasource": {
        "type": "loki",
        "uid": "fe61a18a-f94b-446f-b263-41ae5c13b412"
      },
      "gridPos": {
        "h": 19,
        "w": 24,
        "x": 0,
        "y": 0
      },
      "id": 1,
      "options": {
        "dedupStrategy": "none",
        "enableLogDetails": true,
        "prettifyLogMessage": false,
        "showCommonLabels": false,
        "showLabels": false,
        "showTime": false,
        "sortOrder": "Ascending",
        "wrapLogMessage": true
      },
      "pluginVersion": "10.1.9",
      "targets": [
        {
          "datasource": {
            "type": "loki",
            "uid": "fe61a18a-f94b-446f-b263-41ae5c13b412"
          },
          "editorMode": "builder",
          "expr": "{filename=\"$filename\"} |= `$keyword` | pattern `<_>  <level> <_>`",
          "queryType": "range",
          "refId": "A"
        }
      ],
      "title": "服务日志",
      "type": "logs"
    }
  ],
  "refresh": "",
  "schemaVersion": 38,
  "style": "dark",
  "tags": [],
  "templating": {
    "list": [
      {
        "current": {
          "selected": false,
          "text": "/apps/metaMeetUser/java/nohup.out",
          "value": "/apps/metaMeetUser/java/nohup.out"
        },
        "datasource": {
          "type": "loki",
          "uid": "fe61a18a-f94b-446f-b263-41ae5c13b412"
        },
        "definition": "",
        "hide": 0,
        "includeAll": false,
        "label": "文件名称",
        "multi": false,
        "name": "filename",
        "options": [],
        "query": {
          "label": "filename",
          "refId": "LokiVariableQueryEditor-VariableQuery",
          "stream": "",
          "type": 1
        },
        "refresh": 1,
        "regex": "",
        "skipUrlSync": false,
        "sort": 0,
        "type": "query"
      },
      {
        "current": {
          "selected": true,
          "text": [
            "None"
          ],
          "value": [
            ""
          ]
        },
        "datasource": {
          "type": "loki",
          "uid": "fe61a18a-f94b-446f-b263-41ae5c13b412"
        },
        "definition": "",
        "hide": 0,
        "includeAll": false,
        "label": "日志等级",
        "multi": true,
        "name": "level",
        "options": [],
        "query": {
          "label": "level",
          "refId": "LokiVariableQueryEditor-VariableQuery",
          "stream": "{filename=\"$filename\"}",
          "type": 1
        },
        "refresh": 1,
        "regex": "",
        "skipUrlSync": false,
        "sort": 0,
        "type": "query"
      },
      {
        "current": {
          "selected": false,
          "text": "",
          "value": ""
        },
        "hide": 0,
        "label": "关键词",
        "name": "keyword",
        "options": [
          {
            "selected": true,
            "text": "",
            "value": ""
          }
        ],
        "query": "",
        "skipUrlSync": false,
        "type": "textbox"
      }
    ]
  },
  "time": {
    "from": "now-6h",
    "to": "now"
  },
  "timepicker": {
    "hidden": false,
    "refresh_intervals": [
      "5s",
      "10s",
      "30s",
      "1m",
      "5m",
      "15m",
      "30m",
      "1h",
      "2h",
      "1d"
    ]
  },
  "timezone": "",
  "title": "app_logs",
  "uid": "a9cff19a-019b-4820-9bdd-7c64c5e3cc23",
  "version": 9,
  "weekStart": ""
}
然后就可以在仪表盘列表中看到采集的日志信息了
 0
0